<img height="1" width="1" style="display:none;" alt="" src="https://dc.ads.linkedin.com/collect/?pid=314385&amp;fmt=gif">

Case study Benefits Management Case Study with Network Rail

network rail copy

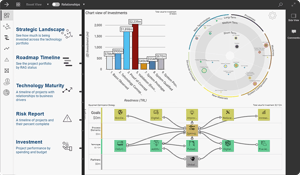
"The portfolio dashboard provides a digital and interactive view of the benefit maps, allowing instant interrogation of benefit data through multiple views, and the ability to isolate relevant information."

Rhianna Warden,
Programme Director (Interim)

The story

Determined to increase the productivity and value-for-money of transport infrastructure projects, a transformative collaboration of 25 partners together with Government, i3P and the Construction Innovation Hub formed Transport Infrastructure Efficiency Strategy (TIES) Living Lab.

According to TIES Living Lab, research shows that up to half of the money invested in infrastructure delivery could be spent more efficiently. The Transport Infrastructure Efficiency Strategy states, ultimately, investment in transport infrastructure will drive growth and productivity across the UK.

This Department for Transport (DfT) programme, in which organizations share information and demonstrate best practice, could revolutionize the way the UK approaches major transport projects. Using data, technology and Modern Methods of Construction (MMC) within live transport infrastructure projects, the TIES Living Lab aims to deliver significant value-adding benefits across the transport infrastructure sector.

Network Rail is one of the Living Lab partners helping to drive smarter transport infrastructure and show how TIES Living Lab programme benefits align with Network Rail. 

The business problem

The benefits of Network Rail’s involvement in the Department for Transport (DfT) TIES Living Lab programmes had been clarified using Visio benefit maps. They painted a very complex picture.  It became immediately apparent at the first board meeting that we needed a tool to manage the benefits value and realization.    

Although Network Rail are very good at defining the benefits case, there was a capability gap in demonstrating benefit realization and no way of bringing those two things together with the tools and templates currently in use. With no overall DfT benefit map for the programmes, Network Rail took a collaborative board action to produce a generic set of benefit maps to help explain the complex programmes, that could also be used by any of the other 25 partners.

In an effort to break down that complexity and bring additional clarity, a portfolio level benefit map had been produced. This view comprised of each individual benefit map in a single diagram with added connector points to show where capabilities and learnings from the 3 Steering Groups were proven by way of outcomes being realized by the Living Lab Physical Asset Demonstrator projects.

  • The benefit maps needed to provide a visual depiction of the outputs being delivered and what those outputs meant by way of  increased capability and outcomes  
  • The benefit maps needed to be dynamic and interactive with a connector to the GCIE Portfolio SharePoint, which was also in development
  • End users needed the ability to quickly drill down to the information they required

SharpCloud was already being used by Network Rail and was suggested as a Benefits Management solution by Barnes Thomas, Business System Owner for SharpCloud at Network Rail.

How did you get started with SharpCloud?

David Waters, from Asset Insights, a SharpCloud partner, worked collaboratively with 2 Business Change Managers in my team at Network Rail on this project. Asset Insights has successfully delivered other projects for Network Rail and David was instrumental in helping us to conceptualize and develop the Benefits Management dashboard as well as overseeing the project with myself.

TIES Living Lab

How is SharpCloud solving the problem?

Using SharpCloud we’ve developed a portfolio set of benefits maps and dashboards which demonstrate the magnitude of the task and simplify the understanding.

The objective of the dashboard is to establish the capability to digitize the benefit maps and enable end users to interrogate the portfolio benefit data. By adding in a budget for each project, and through the weighting of each connector between the different elements of the benefit map, an approximate cost associated with each entry is established.

This provides stakeholders with the ability to employ a willingness to pay decision process, where the effort to measure benefit realization would potentially outweigh the benefit itself. This is about building on the benefits case and turning it into the ability to undertake benefits tracking once the benefits are being realized, in a number of years time, which is key for the Office of Rail & Road as well as TIES.​

This addresses a perpetual problem which is often encountered – How do we demonstrate value?​

  • If done well, this process should help with the quality of data around footbridge specification and construction and will therefore help inform future investment decisions and assessments of value for money / impact on whole life  cost
  • Each benefit map displays a network of benefits, linked to one or more of the bounding Corporate objectives, mapping all the cause and effect relationships between outputs, capabilities, outcomes and benefits​
  • The portfolio dashboard provides a digital and interactive view of the benefit maps, allowing instant interrogation of benefit data through multiple views and the ability to isolate relevant information 
NR case study - Benefits Management

What surprised you about SharpCloud when you started using it?

The potential to be able to automate the benefits realization management reporting by establishing an interface between the SharpCloud based dashboard and Network Rail’s datasets. 

"Each benefit map displays a network of benefits, linked to one or more of the bounding Corporate objectives, mapping all the cause and effect relationships between outputs, capabilities, outcomes and benefits​."

Rhianna Warden
Programme Director (Interim)

What are the benefits of using SharpCloud to your team and to your organization?

Visualization and Value - Digitizing the benefit maps is the priority

The objective is for an end user of the benefits dashboard to be able to identify and classify a benefit, and then point that benefit entry to the relevant Network Rail dataset to track progress and demonstrate benefit realization. This meant that we were able to identify a set of value themes that gave us a clear insight into the complexity.

Benefits of using SharpCloud:

  • It provides an intuitive user interface 
  • It already had an example solution of an interactive benefit map
  • It looked good with just half a day's development time
  • There was the potential to develop the SharpCloud interface with SharePoint 
  • It aligns with the wider Network Rail strategy and with CoE strategy used in Risk Management 
  • The Risk team at Network Rail are using it to visualize and present quantitative data successfully 
  • It had immediate availability to develop

Are you seeing any quantifiable results from using SharpCloud?

  • Validating tracing lines and validation of; start and end dates, benefit owners, cost, percentage, and levels where benefits are quantifiable, benefit vs performance 
  • Interface capability to provide live and interactive interrogation of reporting data

What value is SharpCloud bringing to your organization? 

A Benefits Management dashboard providing a digital view of complex benefit maps.​ SharpCloud cuts through the complexity of the benefits landscape and the dashboard cuts through that complexity by enabling interrogation of the information and highlighting emerging themes, all of which help to inform better decision making.

SharpCloud has enabled us to:

  • Make our benefit maps live, interactive and visual​
  • Be efficient through the ability to connect to existing systems and data sources where possible, eg. SharePoint​
  • Provide a dashboard output to track our benefits​ with the potental to automate benefit tracking 
  • Provide live and interactive interrogation of reporting data ​
  • Inform points of intervention where effort is required to mitigate dis-benefits​
  • Influence the Communications and Engagement strategy​

The Benefits Management dashboard in SharpCloud:

  • Provides a view of project interdependencies
  • Enables the weighting of connectors
  • Provides a basis for willingness to pay decisions
  • Informs future investment decisions

We have very quickly been able to spot emerging themes such as:

  • Which projects are not adding value or the value is unclear
  • The need for better strategic alignment of capabilities and outcomes
  • The potential to use Benefits Mapping to inform strategy and management of the programme
  • The potential to make TIES/Living Lab an outcome and benefits driven programme rather than milestone and delivery led programme

Make every business decision with confidence

Discover how SharpCloud can help you make the best decisions using data, not guesswork.

Discover SharpCloud